What’s going on in the notoriously polluted Gowanus Canal?
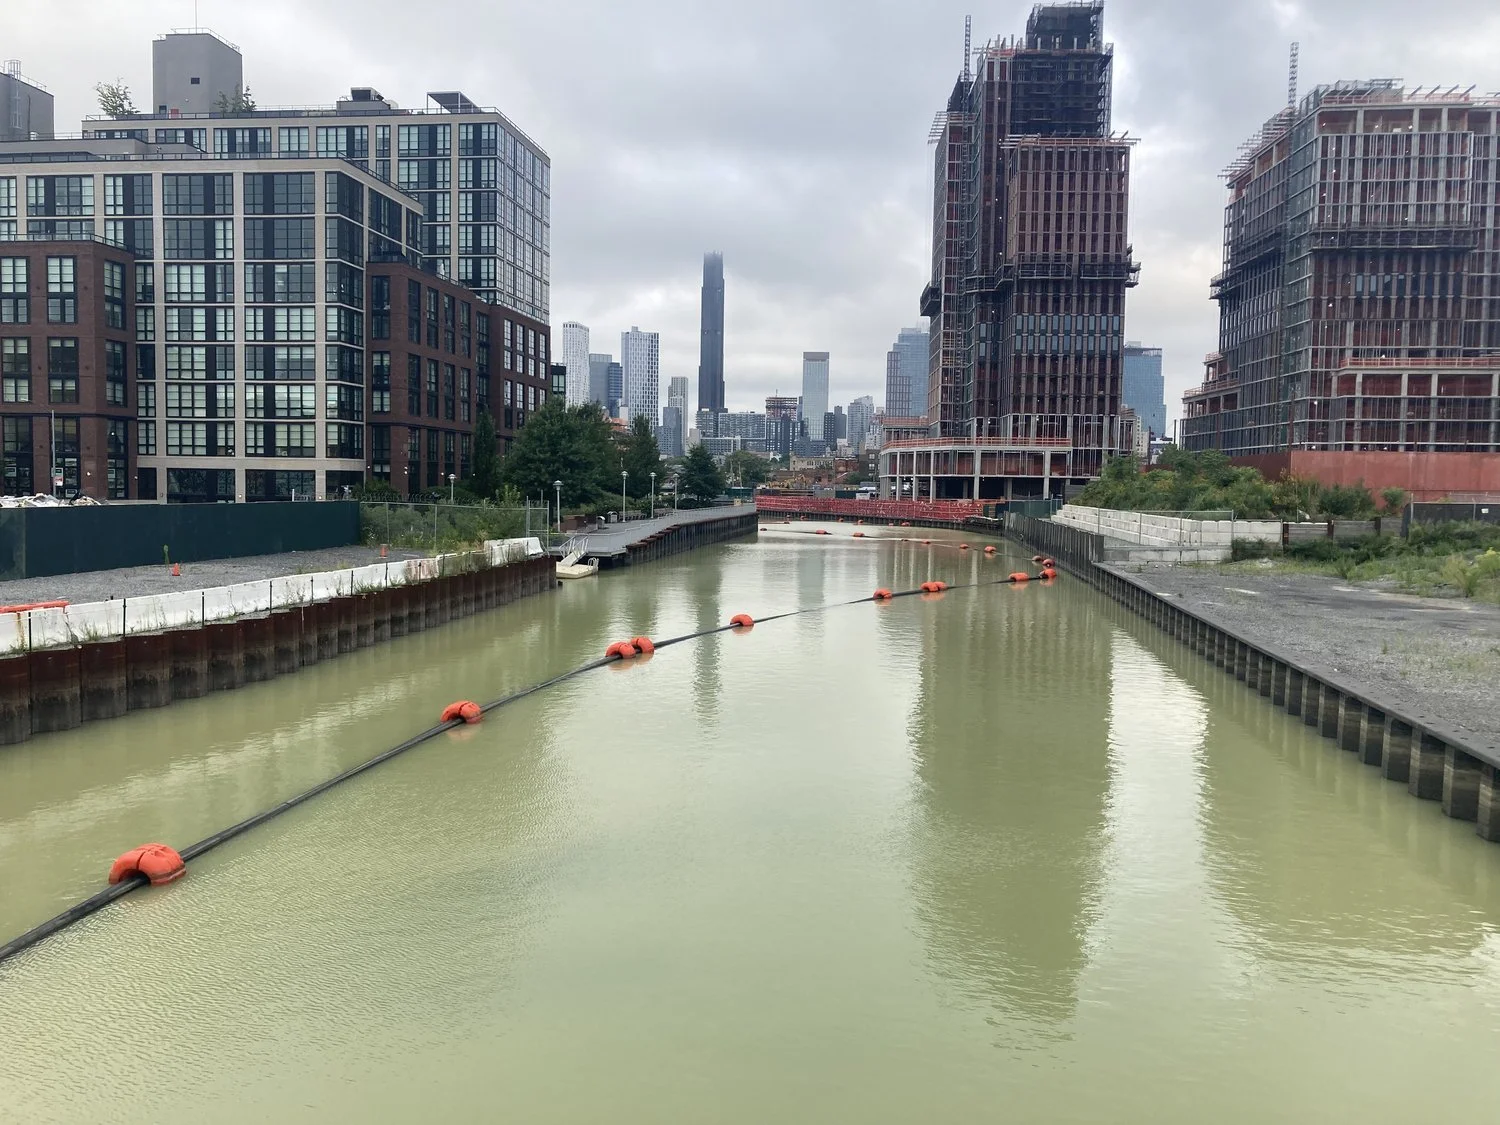
Photo by Eymund Diegel
Platform: Duro UAS Field Kit
Methods: Quantitative Research
Project Type: Science Communication
Responsibilities: Research Design, Data Analysis & Visualization, Project Management, Reporting
Background: In July of 2023, the Gowanus Dredgers hosted a free open canoeing event, where the public was met with an unusual sight: thousands of dead fish in the Canal. In response to unproductive conversations with city and federal agencies, the club advocated for continuous monitoring of dissolved oxygen in the canal, and Captain Gary Francis set out to do near-daily monitoring with a portable testing unit. (You can read more here.) However, he needed help figuring out what to do with the resulting data.
Action: I import, manage, clean, and analyze the raw data collected by our equipment, integrate it with other data sources like weather, tide, and water quality advisories issued by the DEP, and interpret the findings and create data visualizations and presentations to share with the public and water quality experts.
Result: I have presented our monitoring and data visualization efforts locally and at regional conferences. Additional monitoring of dissolved oxygen was conducted by EPA contractors until the Flushing Tunnel at the northern end of the canal could be reactivated in summer of 2024.
Links:
2024 NY-NJ Hudson Estuary Program Conference (YouTube)
Visualizing Community Water Quality Testing Project’s Enterococcus data (App)
Frustrated by lack of water quality data, citizen scientist Gary Francis monitors the Gowanus Canal himself (Brooklyn Paper)